
DNS Firewall Analytics — now in the Cloudflare dashboard
Access GraphQL-powered DNS Firewall analytics directly in the Cloudflare dashboard.
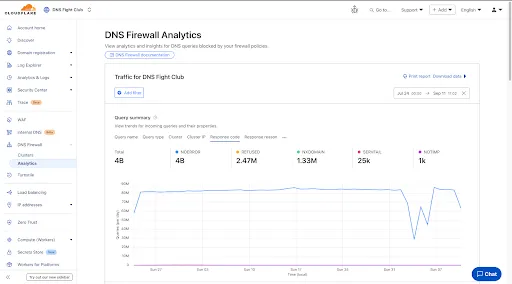
- Query summary: Describes trends over time, segmented by dimensions.
- Query statistics: Describes totals, cached/uncached queries, and processing/response times.
- DNS queries by data center: Describes global view and the top 10 data centers.
- Top query statistics: Shows a breakdown by key dimensions, with search and expand options (up to top 100 items).
Additional features:
- Apply filters and time ranges once. Changes reflect across all panels.
- Filter by dimensions like query name, query type, cluster, data center, protocol (UDP/TCP), IP version, response code/reason, and more.
- Access up to 62 days of historical data with flexible intervals.
Available to all DNS Firewall customers as part of their existing subscription.
- In the Cloudflare dashboard, go to the DNS Firewall page.
- Refer to the DNS Firewall Analytics to learn more.
Was this helpful?
- Resources
- API
- New to Cloudflare?
- Directory
- Sponsorships
- Open Source
- Support
- Help Center
- System Status
- Compliance
- GDPR
- Company
- cloudflare.com
- Our team
- Careers
- © 2025 Cloudflare, Inc.
- Privacy Policy
- Terms of Use
- Report Security Issues
- Trademark